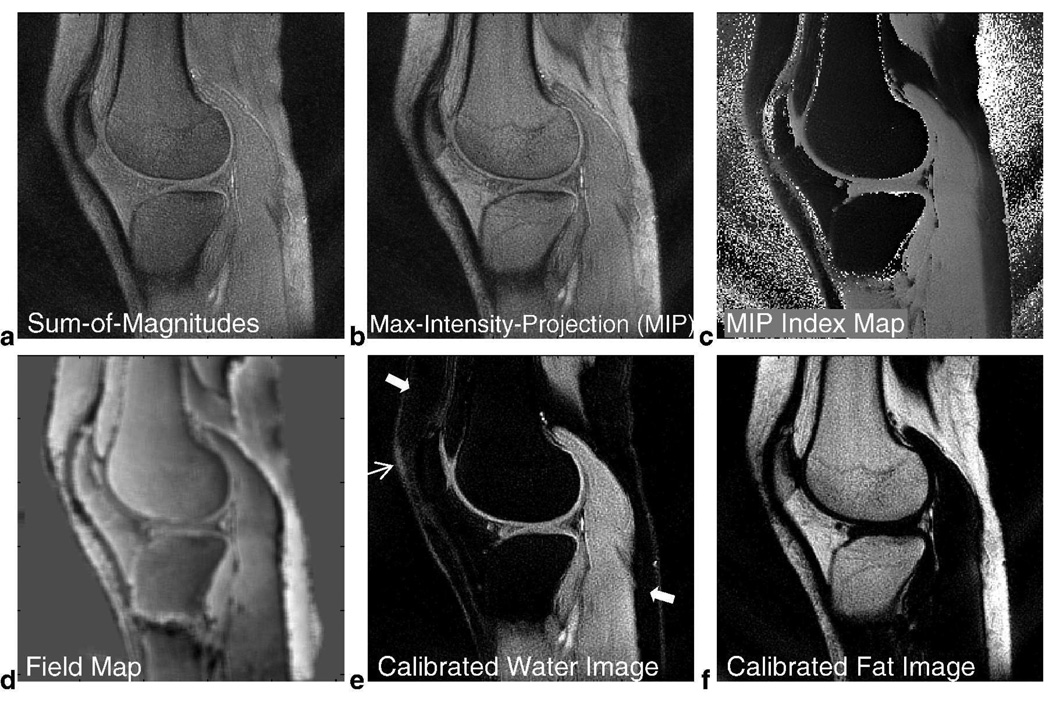
FIG. 10.
In Vivo Knee Results using Spectroscopic Approach for 3-Revolution Dataset. A sum-of-magnitudes image along frequency (a) produces a composite image over this range of chemical shift frequencies. We can also take the maximum-intensity projection (MIP) along frequency to produce another meaningful composite image (b) and its corresponding index map (c) that identifies the maximum frequency component of each voxel. The field map (d) obtained from the index map closely resembles the field map calculated using iterative 3-point Dixon (Fig. 6a). After accounting for the shift in water and fat peaks, the calibrated water image (e) exhibits good fat suppression throughout the FOV (thick arrows) and has more uniform performance near the patella (thin arrow) than iterative 3-point Dixon (Fig. 6b). The calibrated fat image is also shown in (f). The images in (e) and (f) have the same windowing level as Figs. 6b and 6c.

