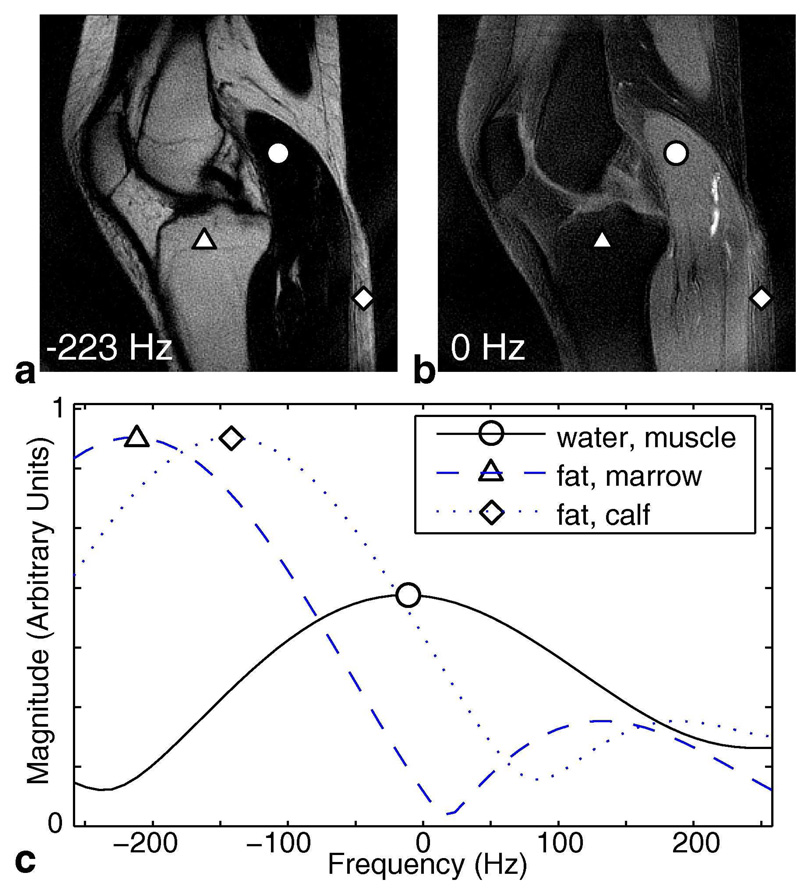
FIG. 7.
Resolving in Frequency for 2-Revolution Dataset. Explicitly reconstructing in 3D k-t space generates a set of 2D images along frequency. Image (a) is the 2D image at −223 Hz (fat resonance) and image (b) is the 2D image at 0 Hz (water resonance). These two images have the same windowing level, and they closely resemble the Dixon fat and water images (Figs. 5b, 5d). Spectra of three representative voxels are plotted in (c) over the range of +/−250 Hz. A typical water voxel (circle) has its peak near 0 Hz and a typical fat voxel (triangle) peaks close to −223 Hz. However, when there is local field-variation in a fat-dominant voxel (diamond), the spectrum is shifted and contributes noticeable signal at water frequency.

