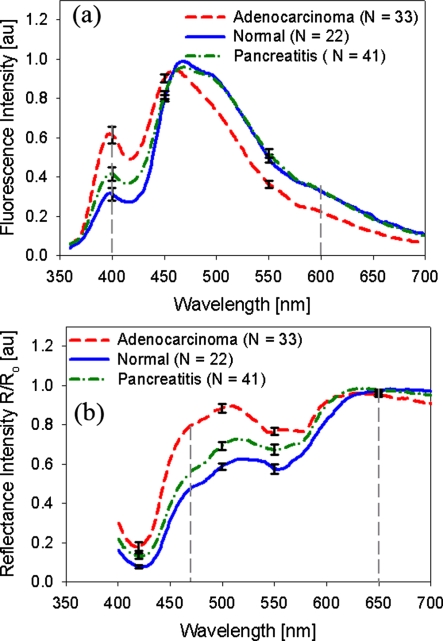
Figure 1.
(a) Mean fluorescence spectra obtained from human pancreatic normal (blue solid line), pancreatitis (green dot-dash line), and adenocarcinoma (red dashed line) tissues. The gray vertical dashed lines indicate the wavelengths at which Fratio(=F400∕F600) was calculated for each spectrum. (b) Mean reflectance spectra obtained from normal (blue solid line), pancreatitis (green dot-dash line), and adenocarcinoma (red dashed line) tissues. The gray dashed lines indicate the wavelengths at which Rratio(=R470∕R650) was calculated for each spectrum. N denotes the number of individual spectra. The standard error is shown at select wavelengths. (Color online only.)

