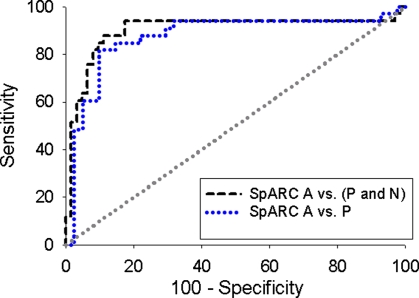
Figure 2.
The receiver operating curves (ROCs) for A versus (P and N) (black dashed line) and A versus P classification (blue dotted line) using the SpARC algorithm, where the areas under the ROCs were 0.901±0.043 and 0.874±0.047, respectively. The gray dotted line indicates the line of no discrimination. (Color online only.)

