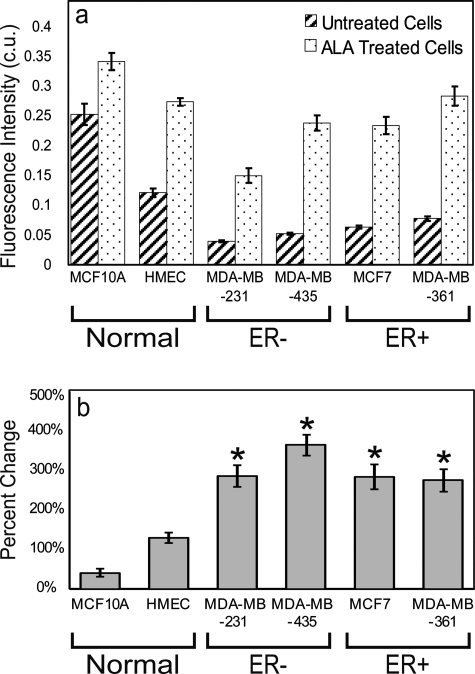
Figure 3.
Average and standard error of the (a) calibrated integrated fluorescence intensity (c.u.) per cell line (n=12) and (b) percentage change in integrated fluorescence intensity of treated compared to the untreated controls (n=12). Asterisks denote that each ALA-treated breast cancer cell line has a statistically higher percentage change in integrated fluorescence compared to ALA-treated normal mammary epithelial cell lines (Normal) (p<0.05).

