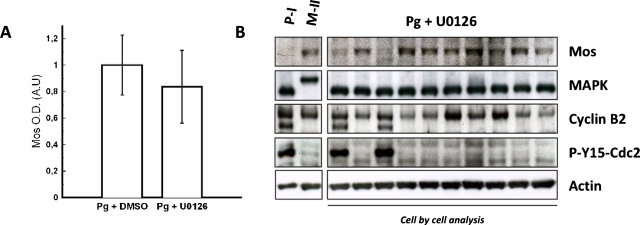
Figure 3. Mos accumulates in the absence of MAPK following progesterone addition.
(A) Histogram depicts normalized values of Mos concentration at GVBD time in control oocytes treated with DMSO vehicle (0%,1%) and in U0126-treated oocytes (50 μM). Mos levels are, respectively, 1±0.22 and 0.83±0.27. (B) Cell by cell analysis by western blot for contents in Mos, MAPK, cyclin B2, phospho-tyrosine 15 Cdc2, and actin. Oocytes were taken at GVBD time for biochemical analysis.

