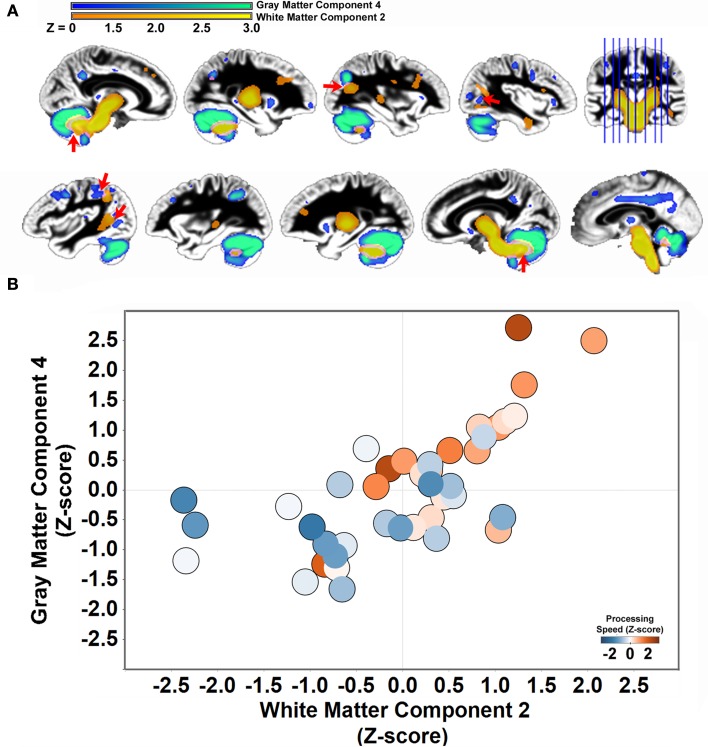
Figure 5.
Structural covariance between cerebellar gray matter and brainstem white matter. (A) Gray matter component 4 is displayed with white matter component 2 to demonstrate the space correspondence between the components (left hemisphere: top row; right hemisphere: bottom row). Note that the white matter component abuts regions of the gray matter component, including in regions throughout the cerebellum, parietal cortex, and parietal–occipital–temporal cortex (red arrows). (B) Individual variation in the volume estimates for gray matter component 4 and white matter component 2 are significantly correlated [r(41) = .68, p < 0.001]. People with elevated cerebellar gray matter had elevated white matter within regions that project to the cerebellum. The circles are shaded to indicate that both components predict performance on the Connections Simple processing speed measure.

