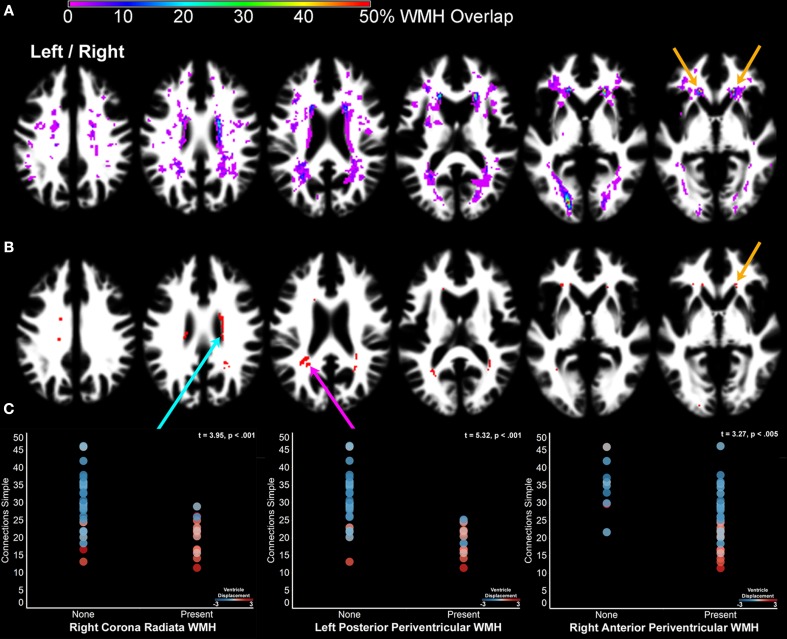
Figure 6.
The impact of cerebral small vessel disease on processing speed. (A) A probability map of WMH. WMH were observed with the highest probability in periventricular regions, as well as the optic radiations. The orange arrows indicate the location of WMH where white matter was segmented as gray matter and identified as part of component 7 (Figure 2 – orange arrow). (B) Nonparametric lesion-mapping results demonstrating locations of WMH most consistently associated with slow processing speed. (C) The presence of a WMH anywhere within the regions presented in (B) was determined for each subject in order to examine the impact of WMH in these regions on processing speed (1% FDR = Z score threshold of 2.33). The scatter plots compare Connections Simple performance for people with and without WMH in the right corona radiata (blue arrow), left posterior periventricular white matter (pink arrow), and right anterior periventricular white matter (orange arrow) regions. The circles are shaded to indicate the degree to which each subject's lateral ventricles had to be displaced during normalization (Figure 1A). Note that the people with WMH had images requiring the most displacement during normalization [WMH classification comparison with ventricle displacement: F(2,41) = 8.95, p < .001]. Left/right refers to left and right hemisphere.

