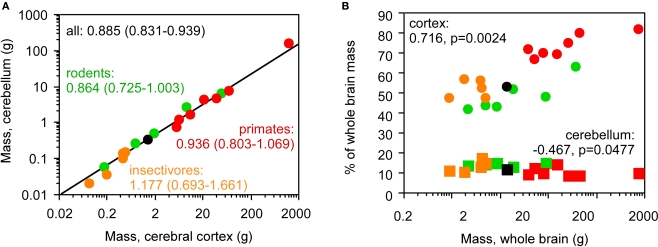
Figure 2.
Discrepancy between the scaling of absolute and relative cortical and cerebellar mass. Each point represents the average values for one species (insectivores, orange; rodents, green; primates, red; scandentia, black), (A) cerebellar mass covaries with cerebral cortical mass in a similar fashion across Eulipotyphla (insectivore), rodent, scandentia and primate species. Power function exponents and 95% confidence intervals are indicated; all values of p < 0.01. The plotted power function applies to all species. The relationship for the ensemble of data is equally well fit with a linear function of slope 0.125 (p < 0.0001, r2 = 1.000; not shown), (B) relative mass of the cerebral cortex (circles), shown as % of total brain mass, increases with total brain mass across all species, but relative cerebellar mass (squares) decreases slightly. Spearman correlation coefficients and p-values are shown. All data are from Herculano-Houzel et al. (2006, 2007), Azevedo et al. (2009) and Sarko et al. (2009).

