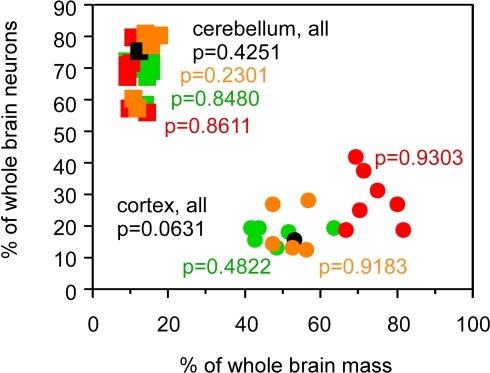
Figure 3.
Relative cortical and cerebellar mass does not reflect the relative number of brain neurons that each contains. Each point represents the average values for one species (insectivores, orange; rodents, green; primates, red; scandentia, black). Circles, relative mass and relative number of brain neurons in the cerebral cortex; squares, relative values for cerebellum. Spearman correlation coefficients and p-values are indicated. All data are from Herculano-Houzel et al. (2006, 2007), Azevedo et al. (2009) and Sarko et al. (2009).

