
Figure 2. Association and linkage disequilibrium plot of the 9q34 locus.
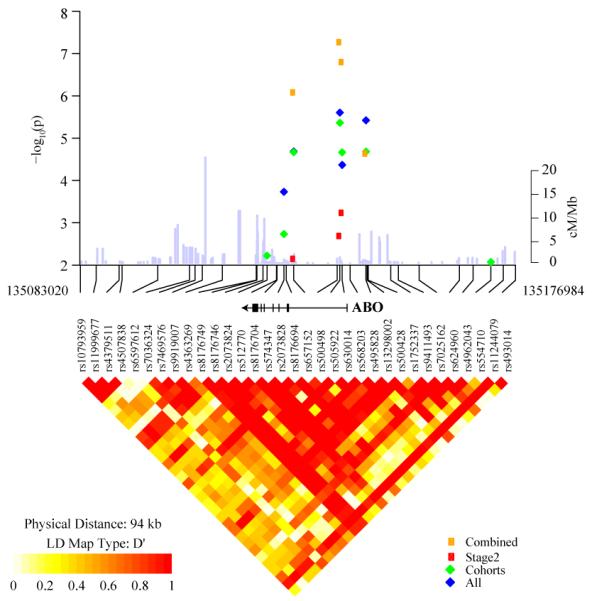
Association results are shown for all GWAS studies (blue diamonds), GWAS cohorts (green diamonds), replication studies (red circles) and all studies combined (yellow circles). Overlaid on the association panel is a plot of estimated recombination rates (cM/Mb) across the region from HapMap Phase II. The LD plot shows a region of chromosome 9 marked by SNPs, rs505922 and rs630014 (r2=0.52 in HapMap CEU and 0.40 in PanScan European control individuals) and bounded by SNPs between chr9; 135,083,020-135,176,984 (NCBI Genome build 36). LD is depicted for SNPs with MAF > 5% within PanScan. Controls of European background (n=1,799 unrelated individuals). Note that rs505922 and rs630014 are located in the first intron of the ABO gene, shown above the LD plot. Only SNPs genotyped in both the GWAS and “Fast Track” replication are shown.