
Figure 1.
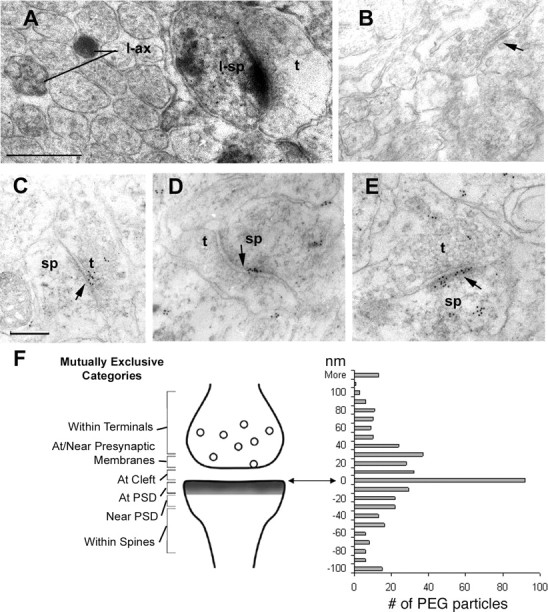
Ultrastructural localization of neurexins in P7 and P8 cerebral cortices and cerebellum of rats as visualized by the HRP–DAB and PEG immunolabels. Using a pan-neurexin antibody followed by HRP–DAB and PEG immunolabels, the variety of perisynaptic positions taken by neurexin is shown. A, HRP–DAB revealed neurexin labeling within many axons of the molecular layer of P7 cerebellum, one example of which is shown here (l-ax). Immediately adjacent to l-ax is an example of dense immunolabeling that occurs along the postsynaptic membrane and intracellularly within spines (l-sp). In contrast, the axon terminal that is presynaptic to the labeled spine is unlabeled (t). Scale bar, 500 nm (also applies to B). Arrows here and in all other panels point to the postsynaptic density. Tissue for this analysis was fixed with 4% paraformaldehyde. Subsequent to the immunocytochemical procedure, the vibratome sections were fixed using 1% glutaraldehyde, followed by 1% osmium tetroxide and counterstaining with 1% uranyl acetate. The light microscopic images of the vibratome section from which these ultrathin sections were sampled are shown in supplemental Figure S1 (available at www.jneurosci.org as supplemental material). B, Vibratome section of P7 cerebellum taken semi-adjacent incubated using the same pan-neurexin antibody that was preabsorbed with the antigen. Immunolabeling was eliminated from spines and axons. C–E, Clusters of immunogold labeling achieved at the PEG stage occur discretely along the plasma membrane of synapses in the infragranular layers of P7 cerebral cortex. C shows an example of PEG particles at and near the presynaptic membrane of an axon terminal (t) and in the cleft. D and E show clusters of PEG particles along the postsynaptic membrane and PSD of dendritic spines (sp) and the synaptic cleft. E shows additional PEG clustered along the spine apparatus and presynaptic terminal (t). Scale bar, 200 nm (also applies to C–E). F, The PEG particle distribution was analyzed relative to synaptic junctions. PEG positions were measured as distance, in nanometers, from the postsynaptic membrane, and all PEG particles were counted in mutually exclusive bins (0–10, 10–20, 20–30 nm, etc.). These distances span six categories described to the left of the diagram as “Within Terminals,” “At/Near Presynaptic Membrane,” “At cleft,” “At PSD,” “Near PSD” (and along the postsynaptic membrane), and “Within Spines” (but away from the PSD). This analysis was based on 419 PEG particles that were associated with 111 labeled synapses showing clear presentation of the synaptic cleft. The labeled synapses were encountered across four grids.