Figure 5.
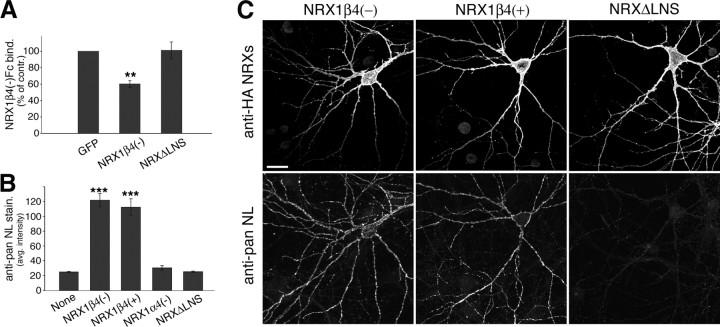
β-Neurexin overexpression results in upregulation of neuroligins in cis. A, Quantification of NRX1β4(−)–Fc binding to control cells (EGFP), cells expressing NRX1β4(−), and cells expressing NRXΔLNS (binding is expressed as percentage of binding observed in control cells transfected with EGFP alone; n = 20 cells; **p < 0.01). B, Quantification of average pan-NL staining intensity on neurexin-expressing cells and control cells (“None”) (n = 10; ***p < 0.001). C, Hippocampal neurons were transfected with EGFP or different neurexin isoforms at 12 DIV and analyzed 2 d later. Cells were coimmunostained with antibodies to the HA epitope on the transfected neurexins (top row) and with anti-pan-NL antibodies (bottom row). Images of the following transfection conditions are shown: NRX1β4(−), NRX1β4(+), and NRXΔLNS. Note that the pan-NL antibody does detect endogenous neuroligin staining but that this staining is barely visible in these images. Because of the strong increase in endogenous neuroligin staining on the neurexin-expressing cells, confocal settings had to be set such that pan-NL staining in the nontransfected cells is very dim. For an image of endogenous NL staining in control cells, see Figure S3 (available at www.jneurosci.org as supplemental material). Scale bar, 20 μm.

