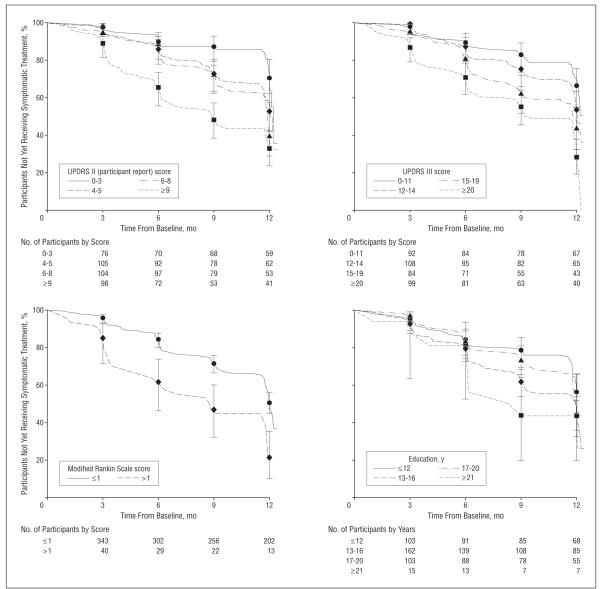
Figure.
Kaplan-Meier curves of time to symptomatic therapy initiation by baseline variables in the final Cox model. Number of participants in each group remaining in the study are indicated beneath the graphs. Error bars represent 95% confidence intervals; UPDRS, Unified Parkinson Disease Rating Scale.

