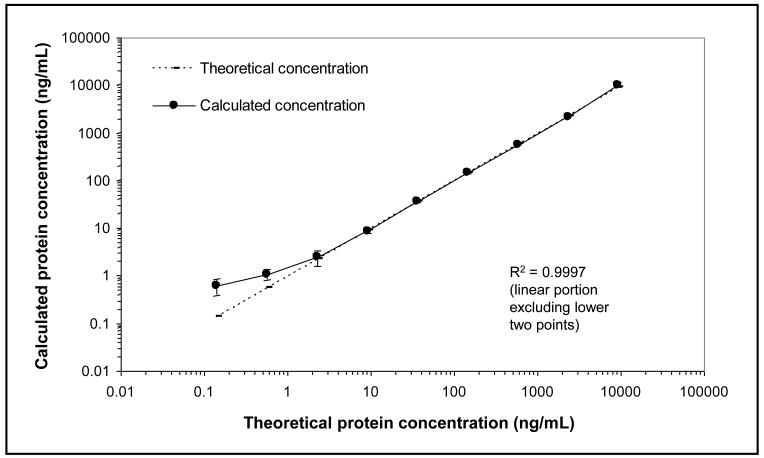
Figure 3.
Response curve for the mouse ADAM17(VDN)-83-17 monoclonal antibody SISCAPA assay. Varying amounts of heavy peptide and a constant amount of light peptide were spiked into 10 μL of human plasma digest, the sample was diluted to 100 μL, and the peptides were captured, eluted, and detected using SISCAPA LC-SRM-MS. Linear regression analysis was performed on log-transformed peak area ratios of the heavy-to-light peptide signals versus the theoretical protein concentrations (back-calculated to undiluted plasma). Calculated protein concentrations were obtained with the resulting regression coefficients.

