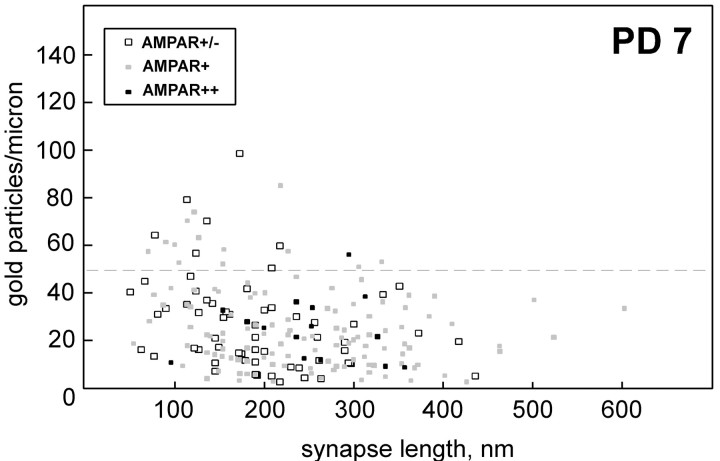
Fig. 9.
Density of α7nAChR labeling as a function of synapse length in PD 7 synapses. Data points are grouped according to the degree of postsynaptic AMPAR labeling: intense (black squares), moderate (gray squares), or minimal/absent (white squares). Pointsabove the dotted line correspond to those to the right of the 50 particle per micrometer bin (inclusive) in the PD 7 histogram (Fig. 8). Note the relative absence of larger synaptic profiles and intensely AMPAR-positive synapses in this group. The data set is the same one used for PD 7 in Figure 7.

