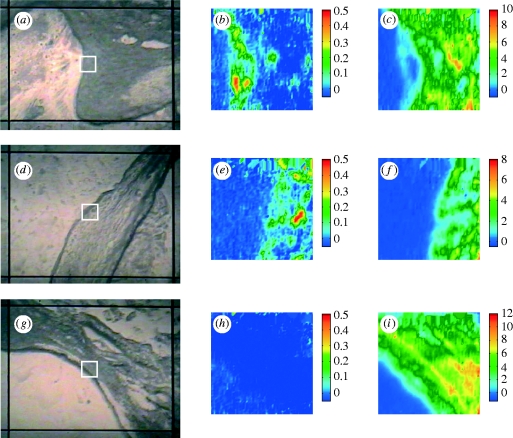
Figure 4.
Photomicrograph and micro-ATR–FTIR images of various rabbit aortic sections. (a–c) Downstream margin of the ostium at the intima–media boundary in a branch-containing section from an immature rabbit fed an l-arginine-supplemented diet: (a) photomicrograph; the FTIR images refer to the distribution of the integrated absorbance of (b) ν(C=O)ester and (c) amide I bands in the range of 1753–1707 cm−1 and 1715–1585 cm−1 respectively. (d–f) Lateral margin of the ostium at the intima–media boundary in a section of mature rabbit aorta, cut at the branch side; integrated bands: (e) ν(C=O)ester (1753–1707 cm−1) and (f) amide I (1715–1585 cm−1). (g–i) Lateral margin of the ostium at the intima–media boundary in a section of mature rabbit fed an l-arginine-supplemented diet; integration of (h) ν(C=O)ester region between 1753 and 1707 cm−1 and (i) amide I band between 1715 and 1585 cm−1.

