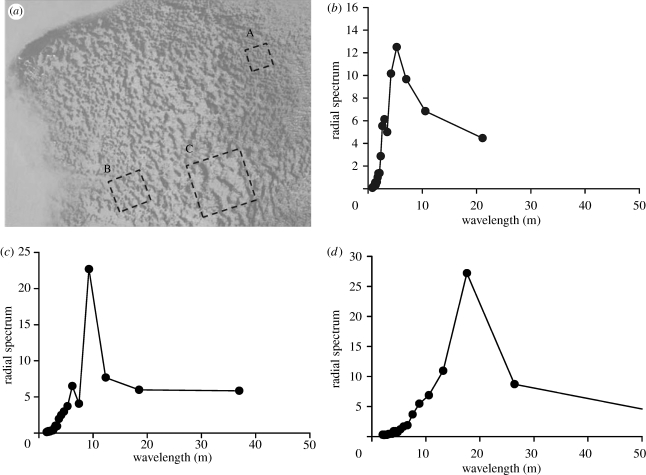
Figure 12.
An illustration of different wavelengths occurring in a single mussel bed. (a) A patterned mussel bank in the Wadden Sea, The Netherlands (53°27.64′ N, 6°13.95′ E taken on 12 October 2001). (b–d) Spectral analysis of the mussel patterns as observed in three cut-outs A, B and C, respectively, within the aerial image. The three graphs represent the amount of variance explained by a cosine of a specific wavelength, as specified by the x-axis direction.

