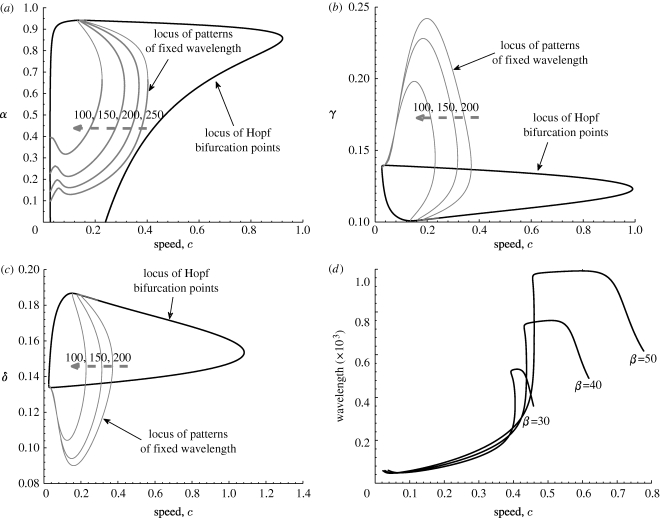
Figure 7.
An illustration of the variations in parameter space of the solution structure of the pattern ODEs (4.1). We plot the loci of Hopf bifurcation points and patterns of fixed wavelength for (a) α versus c, (b) γ versus c and (c) δ versus c. In (a–c) the value of the wavelength along the dashed curve is 20 000. (d) Comparison of travelling wave families for system (4.2) with different values of the parameter β (labelled). The parameter values are based on the estimates of table 1: γ=0.1333, δ=0.140, β=41.5692 and α=0.6667.

