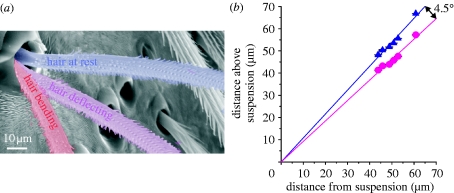
Figure 6.
(a) SEM micrograph depicting the three regimes that characterize the large-scale load curves shown in figure 7 a. (b) Positions of the trichobothrium in its zero (resting) position (triangles) and positions of first contact of the hair shaft with the socket rim (circles) with lines fit to the data. The origin of the curve represents the position of the hair suspension (N=1, n=30) (N, number of trichobothria; n, number of measurements).

