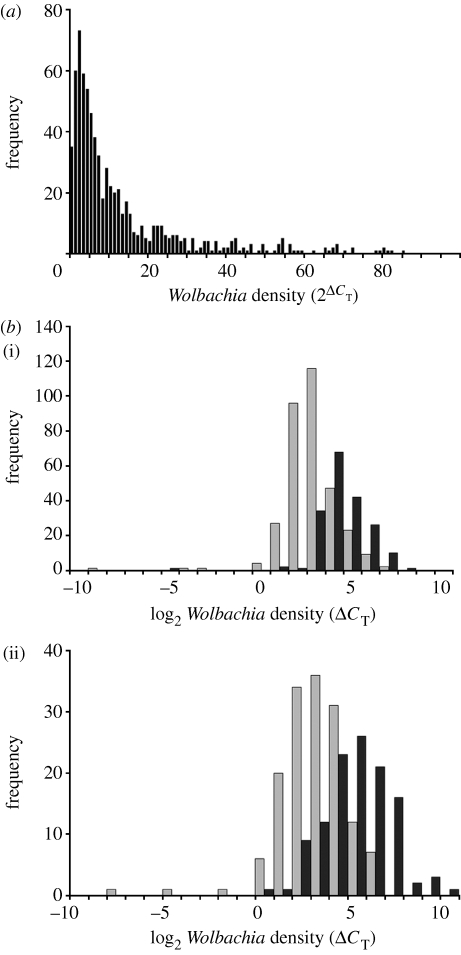
Figure 1.
Distribution of Wolbachia densities in ovaries from wild-caught D. innubila in 2006 and 2007. (a) Relative Wolbachia densities within infected females, estimated as 2ΔCT. This includes only females within the middle 95% of infection densities for all collections combined. (b) Log2-transformed Wolbachia density, ΔCT, during four collection periods. Grey bars represent flies from early in the monsoon season and black bars represent flies from late in the monsoon season. Data for (i) 2006 and (ii) 2007 plotted separately.

