
Figure 3.

(a) Average value of the interaction effect fij at various distance dij and angle θij during experimental condition 2. (b) For a given angle θ, the function fθ(d, θ) describing the directional changes, (i) θ=4°; (ii) θ=9°; (iii) θ=17°, decreases exponentially with d, which provides the relation 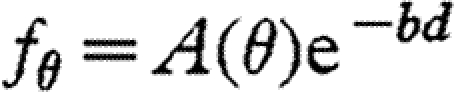 , with fit parameter b. (c) A(θ) can then be approximated by the equation
 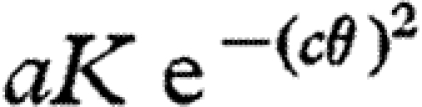 , where K is the sign of θ and a, c are fit parameters. The function fv(d, θ) for speed changes has been set according to a similar functional dependency.