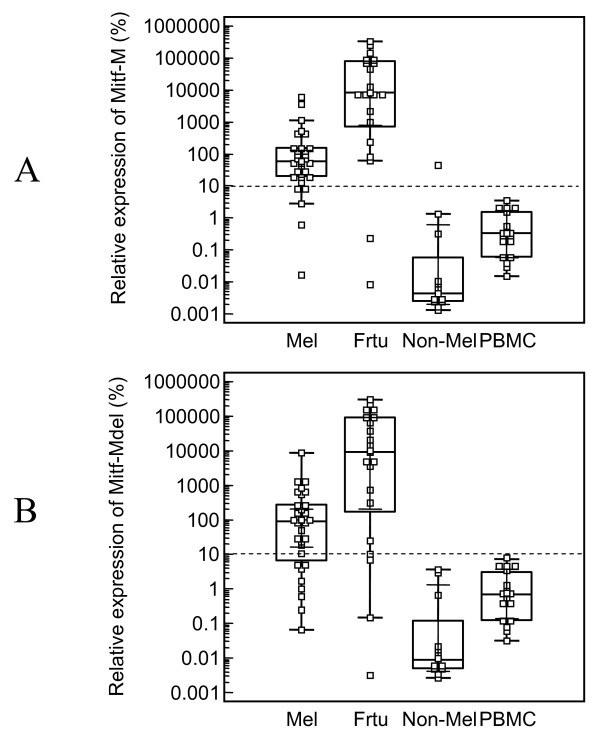
Figure 4.
Relative expression of microphthalmia-associated transcription factor (MITF)-M (A) and MITF-Mdel (B) in 31 melanoma cell lines, 21 frozen melanoma tissue samples, 18 PBMCs from healthy donors, and 12 non-melanoma cell lines, including three breast, five glioma, one sarcoma, two kidney and one ovarian cancer cell lines. Data was calculated using ΔΔCt method. Melanoma cell line 624 mel was used as normalization control and its MITF-M and MITF-Mdel relative expression levels were set as 100%. Bars indicated median of expression levels of MITF-M or MITF-Mdel mRNA in each group.

