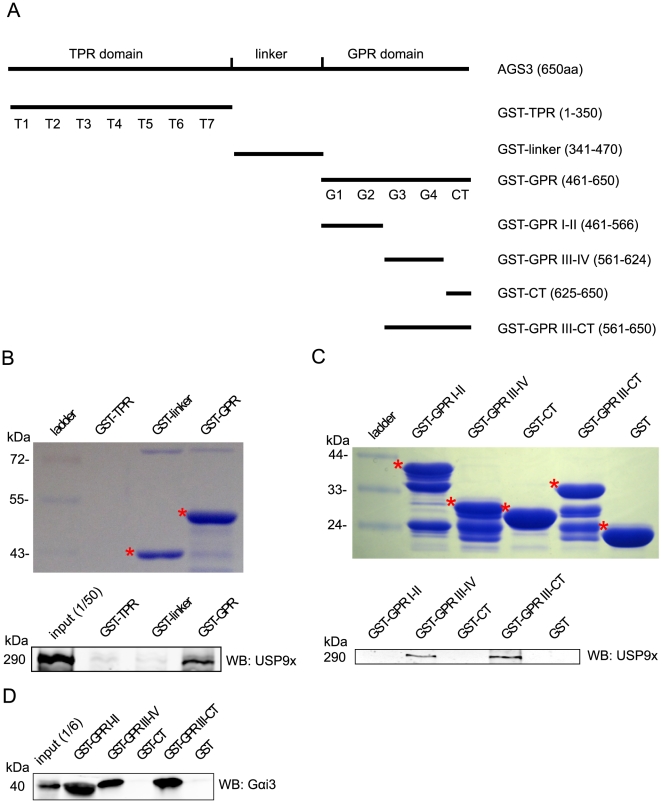
Figure 2. Mapping of the USP9x-interacting domain of AGS3.
(A) Schematic illustration of the regions covered by the different GST-AGS3 constructs used in the GST pull-down experiments. (B) and (C) Top panels: Coomassie blue gels showed the GST fusion proteins and their relative amounts used in the GST pull-down. The full-length fusions are indicated by asterisks except for GST-TPR whose expression was too low to be detected. The lower molecular weight bands are probably the products of degradation. Bottom panels: Equal amounts of HEK293 cell lysates were incubated with various GST fusion proteins bound to glutathione beads. After wash, the GST pull-down samples were eluted from the beads and probed with anti-USP9x (1 µg/ml) in western blot analysis. (D) The pull-down was performed as described in (C) except that the elutes were probed with an anti-Gαi3 antibody (1 µg/ml).

