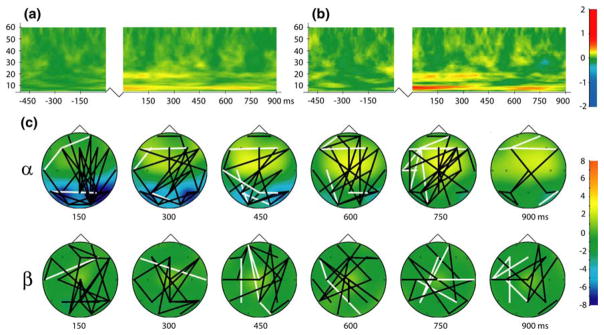
Fig. 3.
a Global long-distance phase synchronization obtained by averaging PLV across all 171 analyzed sensor pairs. b Frontoposterior phase locking obtained by averaging PLV across all connections between frontal (LF11, RF11, LF32, RF32, LT21, RT21, ZFO3) and posterior (LO22, RO22, LO41, RO41, LO43, RO43, ZP02) sensors (49 pairs). Jagged lines in time–frequency plots represent temporal discontinuity (presentation of S1 between baseline and retention interval). c Topography of local and long-range alpha (9 Hz) and beta (18 Hz) band synchronization during short-term memory retention. Black lines indicate statistically significant phase synchronization between sensors (P < 0.05); white lines denote significant desynchronization (P < 0.05). Colors represent changes in amplitude (local synchronization) in units of standard deviation from the baseline; legends at right (color figure online)

