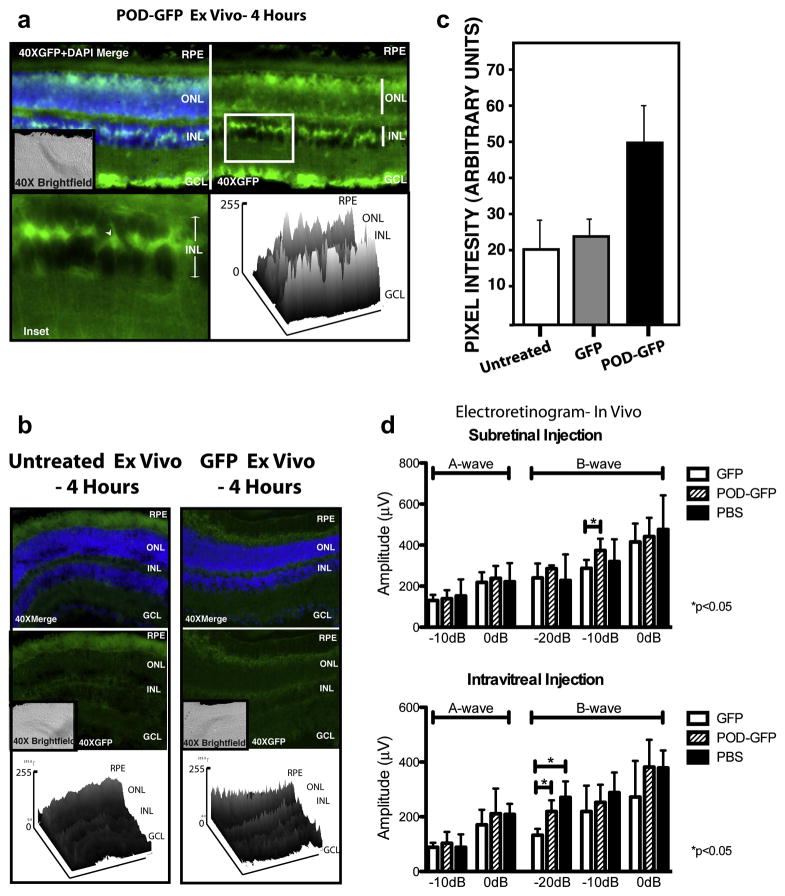
Figure 5. Transduction properties of POD-GFP ex vivo and electroretinograms of POD-GFP injected eyes in vivo.
POD-GFP or GFP protein was placed in the eyecups of adult mice for 4 hours. Significant levels of GFP were detected in the GCL, a subset of cells in the INL (arrowhead) and potentially the ONL (a). Relatively lower levels of GFP were detected in the eyecups of GFP-injected or uninjected animals (b), as confirmed in the accompanying surface plots. (c) Total GFP-intensity for each fusion protein. POD-GFP, GFP n=4, untreated, n=3. Electroretinograms (ERGs) were performed 48 hours following subretinal or intravitreal injections of POD-GFP, GFP, or PBS (d). Graphical representation of the amplitude of A and B-waves at the indicated flash intensities following subretinal injection or intravitreal injection indicate no significant difference (p > 0.05) between POD-GFP and PBS for all light intensities examined. * p < 0.05. n=4 for each protein. GCL, ganglion cell layer, INL, inner nuclear layer, ONL, outer nuclear layer, RPE, retinal pigment epithelium. Color version of this figure appears online.

