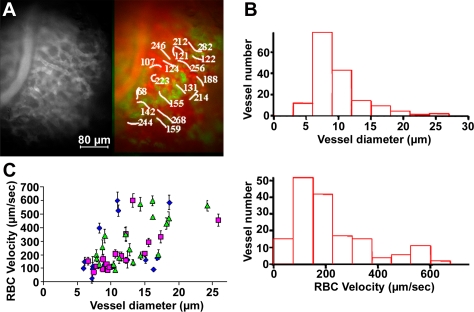
Fig. 2.
RBC velocities in the microcirculation of GH-eGFP mice. (A) In vivo imaging of rhodamine dextran-labeled vasculature (Left) and corresponding RBC velocities in vessel branches (colored in red) in a GH-eGFP (green) pituitary (Movie S3). (B) Plots of vessel numbers as a function of vessel diameters (Upper) and RBC velocities (Lower), respectively. (C) RBC velocities as a function of vessel diameters in rostral (green triangles), central (violet circles) and caudal (blue squares) regions of a lateral part of a GH-GFP pituitary. Data are reported as means ± SD.

