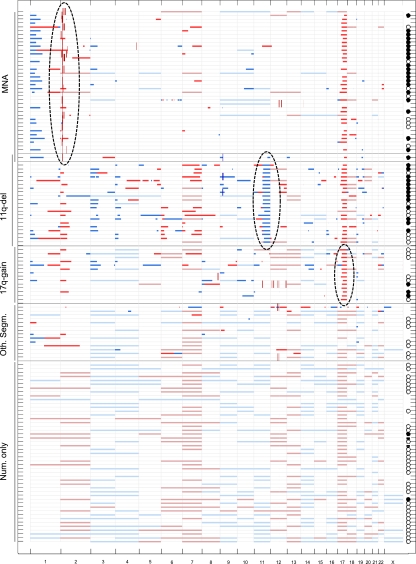
Fig. 1.
Summary of SNP array data of gains and losses for 134 NB cases. Horizontal lines show segmental loss (clear blue) and gain (clear red) and whole chromosome loss (pale blue) and gain (pale red). Short vertical lines show amplification (brown) or homozygous loss (dark blue). The genomic profile group is indicated to the left. The inclusion features for the three high-risk groups—MYCN amplification, 11q deletion, and 17q gain—are indicated by dotted ovals. Note that only one case has both MYCN amplification and 11q deletion. Patients who have died of disease are indicated to the right by filled black circles, whereas patients who are still alive and have an overall survival of at least 5 years are indicated by open circles. Two cases in the numerical-only group are represented by a horizontal line; these patients died of surgical complications. Cases with a flat profile (n = 31) are not shown. See Materials and Methods for definitions of the genomic groups.

