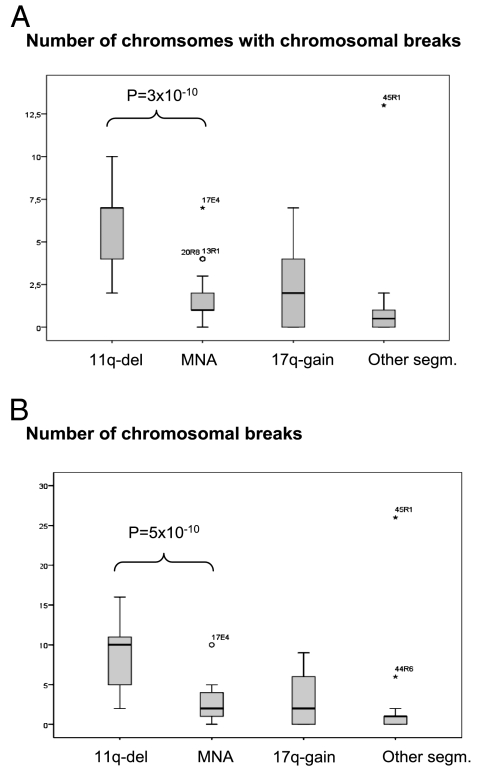
Fig. 2.
Boxplots showing that the 11q-deletion tumors have significantly more chromosomal breaks than the other groups. (A) Number of chromosomes with chromosomal breaks for each case. (B) Number of chromosomal breaks per case. In the boxplots, the upper and lower hinges of the box represent the 75th and 25th percentiles, respectively; whiskers indicate the highest and lowest values that are not outliers or extreme values; the thick horizontal line represents the median; open circles represent outliers; and asterisks represent extremes. The groups were compared after adjustment for ascertainment biases. The level of significance for the difference between the 11q-deleted and MYCN-amplified groups is indicated in both figures.

