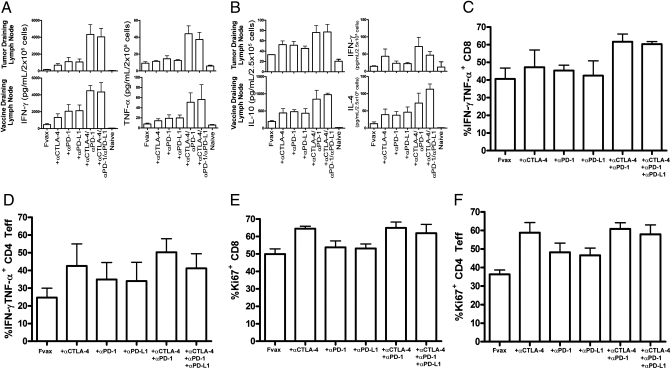
Fig. 5.
Changes in cytokine production in response to coinhibitory blockade. Mice challenged with 2.5 × 10⁵ B16-Ova cells and treated on days 6, 9, and 12 were killed on day 14. T cells were purified from tumor-draining lymph nodes and vaccine-draining lymph nodes, stained with antibodies, and sorted by flow cytometry into CD4+ and CD8+ subsets. Cytokine production was measured after 36 h using the TH1/TH2/TH17 CBA Kit and is shown for 2 × 10⁵ CD8 T cells restimulated on 1 × 10⁵ Ova 257–264 peptide-pulsed DCs (A) and for 2.5 × 10⁵ CD4 T cells restimulated on 1 × 10⁵ Ova 323–339 peptide-pulsed DCs (B). Data are shown for three to four independent experiments with five pooled mice per group. (C and D) TILs were purified from 5–10 pooled tumors per group and enriched using the Miltenyi T-cell purification kit. A total of 2 × 10⁶ TILs were restimulated with 7.5 × 10⁵ DCs [1:1 mix of Ova(257) and Ova(323) pulsed DCs] per well for 8 h in the presence of GolgiPlug. Cells were fixed using the FoxP3 kit and analyzed by flow cytometry for lymphocyte markers and intracellular IFN-γ and TNF-α production for CD8 cells (C) and CD4 Teffs (D) and also for Ki67 expression in CD8 cells (E) and CD4 Teffs (F). TIL data are from four independent experiments. All means shown are ± SEM.

