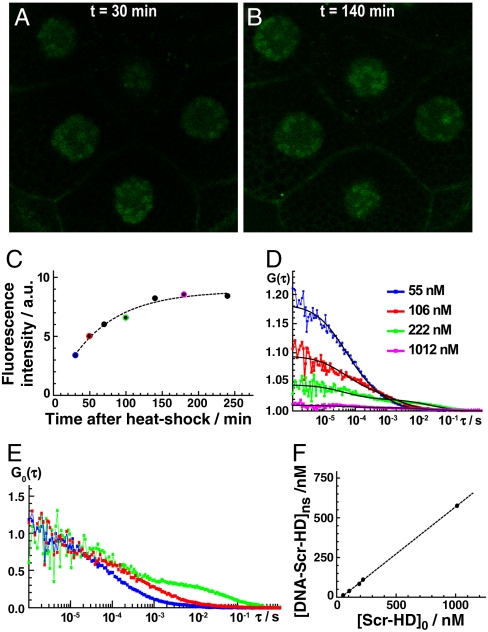
Fig. 2.
Controllable Scr-HD expression in vivo. (A) APD image of salivary gland nuclei expressing the synthetic Scr-HDwt transcription factor. Heat shock was applied by keeping the Drosophila larvae at 37 °C for 30 min. The image was recorded 30 min after heat shock, when the expression was still low and close to physiological levels. Minimal expression was obtained by the UAS construct without the Gal4 driver. (B) APD imaging showing elevated expression of Scr-HDwt 140 min after heat shock. (C) Gradual increase of Scr-HDwt concentration in live salivary gland cells recorded by time-lapse APD imaging. (D) Gradual increase of Scr-HDwt concentration in live salivary gland cells recorded by FCS. The color code indicates FCS measurements performed just after APD imaging, represented in (C) by the corresponding color. (E) Normalized autocorrelation curves showing changes in Scr-HDwt dynamics as a function of its concentration. All FCS measurements were performed at the same location in the same cell. (F) The concentration of the second component increases linearly with the total concentration of Scr-HDwt.

