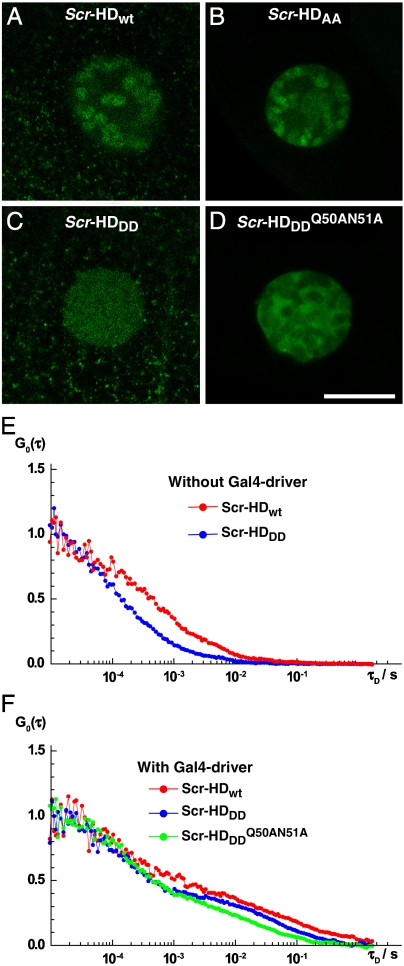
Fig. 3.
Differences in DNA–Scr-HD interactions between different Scr-HD variants visualized in polytene nuclei of live salivary gland cells by APD imaging and FCS. (A–D) Polytene nuclei expressing the synthetic Scr-HDwt, Scr-HDAA, Scr-HDDD and  at low, physiologically relevant concentrations [Scr-HDwt] = 105 nM, [Scr-HDAA] = 157 nM, [Scr-HDDD] = 66 nM and
  . (E–F) Differences in DNA–Scr-HD interactions between the transcriptionally active and inactive variants can be readily observed at low but are less distinguishable at high Scr-HD concentrations.

