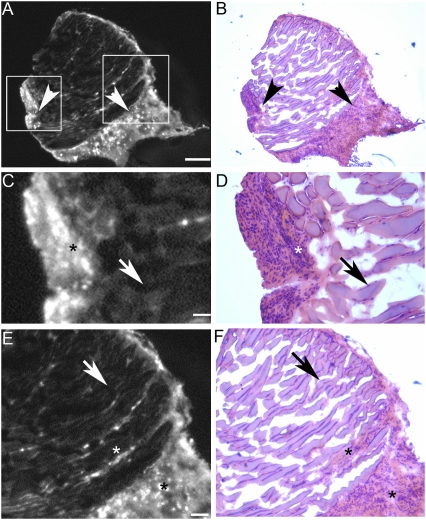
Fig. 4.
Histological analysis of surgical specimens derived from ACPPD-guided surgery. Photomicrographs showing a representative specimen from the B16F10 isograft model that was excised with fluorescently labeled ACPPD guidance. (A) Low-power Cy5 fluorescence showing positive ACPPD uptake (arrowheads). (B) The same section as in A stained with H&E, confirming the presence of malignant cells in regions that show increased fluorescence uptake (arrowheads). (C and E) Enlarged fluorescence images from the boxed areas in A, showing the demarcation between high (*) and low (arrows) fluorescence uptake. (D and F) Histological (H and E) analysis of C and E, showing that the areas of high fluorescence uptake correspond to malignant cells (*). (Scale bar in A and B: 0.5 mm; C and D: 0.1 mm; E and F: 0.25 mm.)

