Fig. 2.
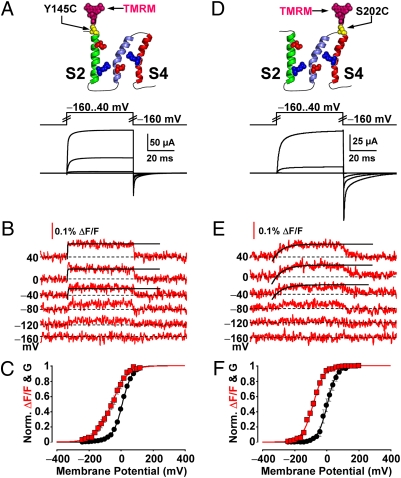
Voltage-dependent structural transitions and ionic conductance from S2- and S4-labeled channels. (A) Voltage pulses and characteristic evoked K+ currents from BKCa channels labeled with TMRM at position 145 (outside S2). (B) TMRM fluorescence traces recorded during the voltage pulses in A. Fitted activation exponentials (black) are τ = 0.130 μs for the 40 mV pulse, 220 μs for 0 mV, 300 μs for −40 mV. (C) Normalized K+ conductance (G, black circles) and ΔF/F (red squares) plotted against membrane potential and fitted with Boltzmann distributions (black and red curves, respectively; see SI Text). Boltzmann parameters: G-V Vhalf = 9.9 ± 2.2 mV; z = 0.86 ± 0.1 e0. F-V Vhalf = −58 ± 9.3 mV; z = 0.57 ± 0.05 e0. n = 8 cells. (D–F) As in A–C, for channels labeled with TMRM at position 202, in the short extracellular linker between S3 and S4. Fitted activation exponentials in E (black) are τ = 5.2 ms for the 40 mV pulse, 6.1 ms for 0 mV, 6.0 ms for −40 mV. Boltzmann parameters in F: G-V (black) Vhalf = −1.0 ± 9.0 mV; z = 1.0 ± 0.053 e0. F-V (red) Vhalf = −79 ± 4.2 mV; z = 0.79 ± 0.055 e0. n = 7.

