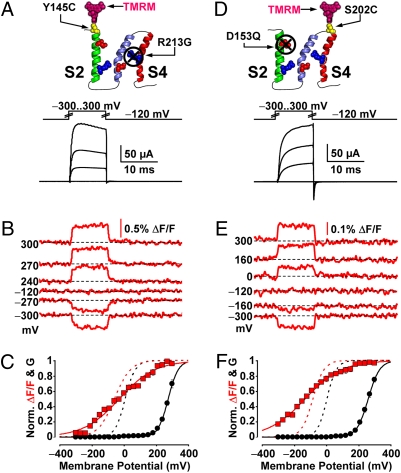
Fig. 4.
Probing for evidence of S2–S4 interaction in the BKCa voltage sensor. (A) Voltage pulses and characteristic evoked K+ currents from BKCa channels labeled with TMRM at position 145 (outside S2) with mutation R213G, to neutralize the single voltage-sensing residue of S4 (44). (B) TMRM fluorescence traces recorded during the voltage pulses in A. (C) Normalized K+ conductance (G, black circles) and ΔF/F (red squares) plotted against membrane potential and fitted with Boltzmann distributions (black and red curves, respectively; see SI Text). Boltzmann parameters: G-V Vhalf = 277 ± 6 mV; z = 0.84 ± 0.01 e0. F-V Vhalf = −28 ± 2 mV; z = 0.24 ± 0.01 e0. n = 5 cells. G-V and F-V curves of the same clone without charge mutation are also included (dashed black and red curves, respectively). (D–F) As in A–C, for channels labeled with TMRM at position 202 (outside S4) with mutation D153Q, to neutralize the voltage-sensing Aspartate of S2 (44). Boltzmann parameters in F are: G-V Vhalf = 260 ± 5.6 mV; z = 0.74 ± 0.041 e0. F-V Vhalf = −130 ± 1.8 mV; z = 0.23 ± 0.018 e0. n = 5.

