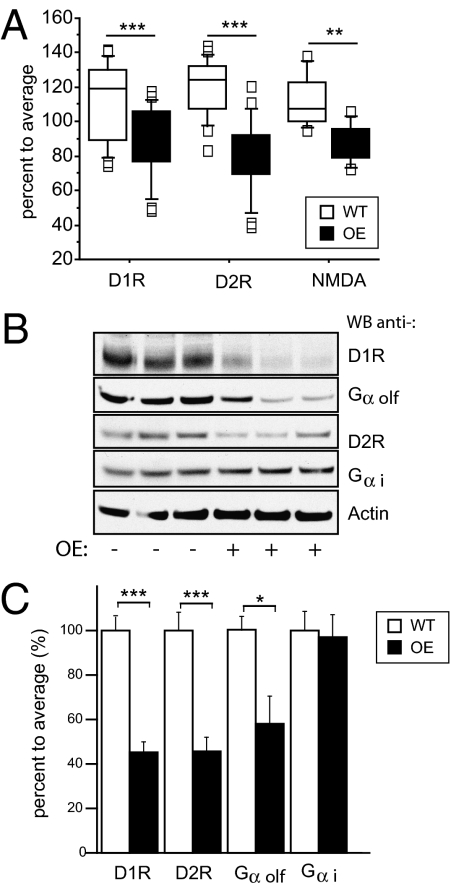
Fig. 7.
Expression levels of D1, D2, and NMDA receptors. (A) Box-and-Whisker plot illustrates quantitation of autoradiographs from ligand binding assays with 3H-SCH23390 (D1R specific antagonist), 3H-quinpirole (D2R specific antagonist), and 3H-MK801 (NMDA receptor antagonist) (n = 5 sections of 3 brains per genotype). Whiskers represent the 1.5 interquartile range. ANOVA, n = 5 or 7 each genotype, P < 0.005, and ***, P < 0.0005. Graph shows the mean values ± SEM. (B) Western blotting analysis of mouse striatal tissue using anti-D1R, anti-Gαolf, anti-D2R, anti-Gαi antibodies, and anti-actin. Three representative samples are shown for each genotype. (C) The Western blots were quantified and data were normalized to beta actin levels (n = 11 per genotype, *, P < 0.01, ***, P < 0005, error bars are SEM).

