Fig. 5.
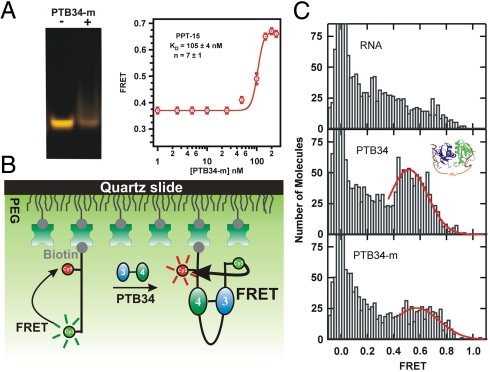
Mutant PTB34 exhibits a different conformation than the WT. (A) Nondenaturing gel electrophoresis of PPT-15 in the presence and absence of PTB34-m. A clear band shift was not observed as for the WT (Fig. 1B). ssFRET titration of PTB34-m and PPT-15. (B) Schematic diagram of the single-molecule experiment. (C) Single-molecule FRET histograms for RNA only (Top), the WT protein (Middle), and the 6-fold mutant (Bottom). Histograms are built from the observed FRET ratios of hundreds of single molecules. The 0-FRET peak corresponds to molecules without an acceptor. The fits to a Gaussian distribution (red lines) are only intended to guide the eye.

