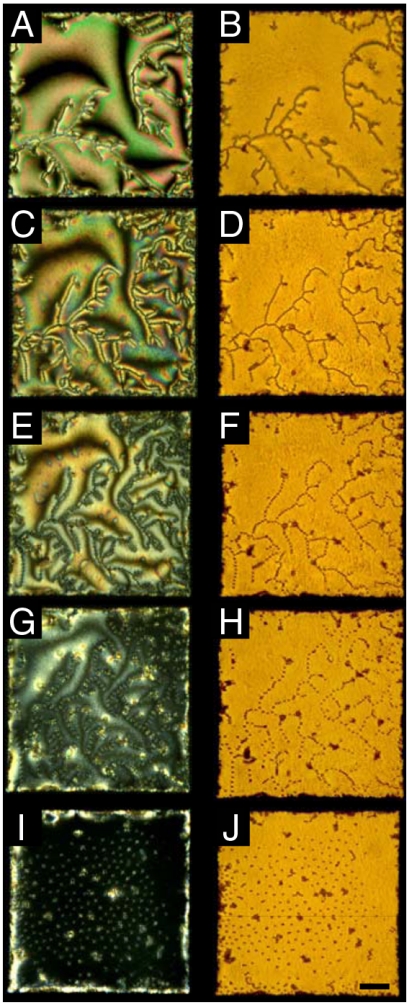
Fig. 3.
Optical micrographs of SDS-induced reordering of microparticle assemblies formed at the nematic 5CB–aqueous interface. The concentrations of SDS in the aqueous phase were 150 (A and B), 550 (C and D), 700 (E and F), 950 (G and H), and 1,300 μM (I and J). Images in the left column were obtained with crossed polars, and images in the right column were obtained in bright-field imaging conditions. (Scale bar: 50 μm.)

