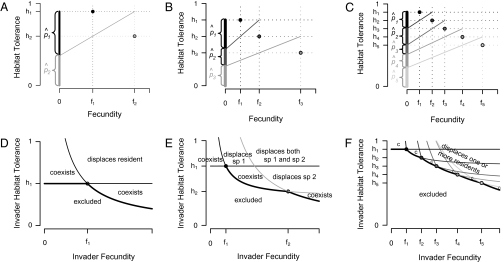
Fig. 2.
Graphical representation of equilibrium abundances,  (A–C), and conditions for coexistence and invasion (D–F) in the tolerance–fecundity model, for different numbers of species. Here species 1 (black) has lowest fecundity and highest habitat stress tolerance (the proportion of habitat in which it can recruit), species 2 (gray) has higher fecundity and lower stress tolerance, species 3 (lighter gray, if present) has still higher fecundity and lower stress tolerance, and so forth. When expressed as the proportion of total area occupied, the equilibrium abundances sum (or “stack”) to
  (stacked bars in A–C). The point at which a line drawn from
  through
  intersects the y axis determines the division between
  and
and  (A–C). Similarly, the division between
  and
and  is defined by the line drawn from
  through
  and on to the y axis (B and C). Coexistence is possible only if these lines intersect the y axis at a
  , a condition met if
  , and if the lines do not cross, which requires
 . The fate of a new species with parameter values f and h introduced into a community depends on its position relative to the curved lines that define these two sets of conditions for the resident species, distinguished here by thin and thick lines, respectively, as well as on its position relative to the horizontal line
  (D–F). All these lines are omitted where they do not influence invader fate. Depending on the parameter combination, the invader may be able to invade and coexist with all residents (“coexists” or simply “c”), be unable to invade and thus be excluded (“excluded”), or invade and displace one or more residents (“displaces sp. 1”, etc.).

