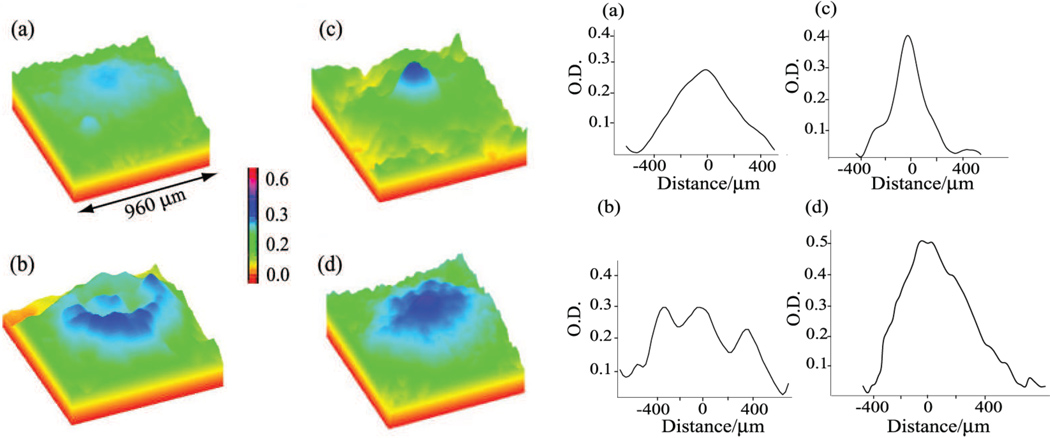
Figure 4.
Varied macular pigment distributions measured by single-wavelength autofluorescence imaging. Pseudocolor images of the macular carotenoid pigments from four individuals are on the left showing narrow and broad distributions and ring structures. Line plots along the horizontal axis for the same subjects are shown on the right. (Reprinted from Sharifzadeh, et al., (2006) with permission).

