Figure 3.

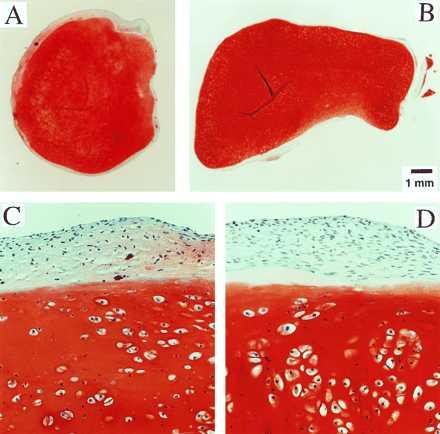
Construct structure. (A and B) Full cross sections of constructs from Mir and Earth groups. (×10.) (C and D) Representative areas at the construct surfaces. (×200.) GAG is stained red with safranin-O.

Construct structure. (A and B) Full cross sections of constructs from Mir and Earth groups. (×10.) (C and D) Representative areas at the construct surfaces. (×200.) GAG is stained red with safranin-O.