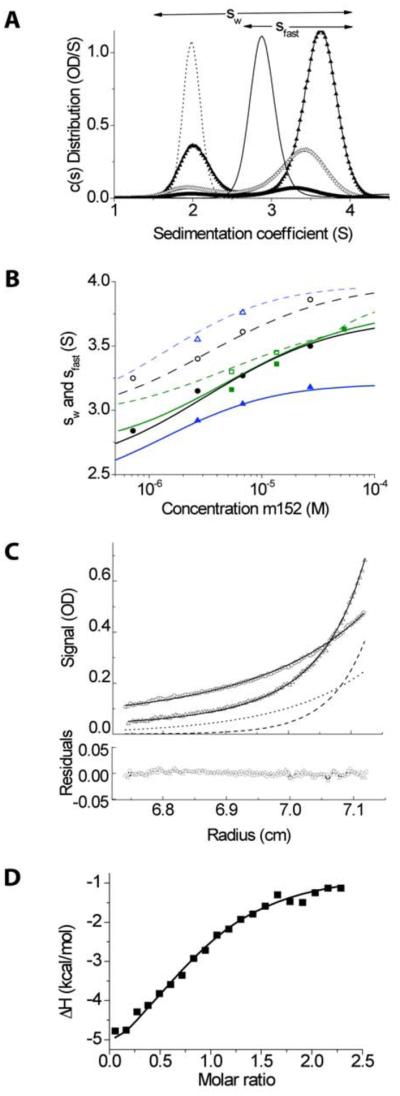
Figure 2. Biophysical experiments show m152 binds to RAE-1 at 1:1 ratio and with micromolar Kd.

A, Sedimentation coefficient distribution c(s) measured in sedimentation velocity (SV) experiments for 11.3 μM RAE-1 alone (dotted line) and 11.3 μM m152 alone (thin line), and 0.63:1 mixtures of RAE-1 and m152 at 1.2 μM (thick line), 4.5 μM (open triangles), and 11.3 μM (filled triangles). Integration of c(s) traces over the range from ~1.5 to ~4.5 S or ~2.5 to ~4.5 S (indicated by horizontal arrows) yields values for the weighted-average s-value sw or the reaction boundary s-value sfast, respectively. B, Isotherms of sw (filled symbols) and sfast (open symbols) as a function of m152 concentration from dilution series at molar ratios RAE-1: m152 of 1.25:1 (black), 0.63:1 (green), and 2.5:1 (blue). The solid lines shown are from a global fit with a 1:1 binding model that incorporated additional data from the relative amplitude of the reaction boundary, as well as the data from isothermal titration calorimetry (ITC). The best-fit sw
value for the complex was 4.3 S, and the binding constant Kd = 4.1 μM. C, Equilibrium absorbance profiles at 280 nm of the mixture of 2.9 μM m152 and 10.2 μM RAE-1 sedimenting at 11,000 (circles) and 17,000 rpm (triangles), their best-fit distribution (solid lines) and the signal predicted for the complex (dotted and dashed lines). These data are taken from a global fit with a 1:1 binding model of 20 equilibrium gradients at different concentrations, rotor speeds, and absorbance wavelengths. D, Enthalpy isotherm from the titration of 100 μM RAE-1 into 10 μM m152 in ITC (symbols), based on a single titration series. The solid line shows the best-fit isotherm from a global fit with the SV isotherm data.
