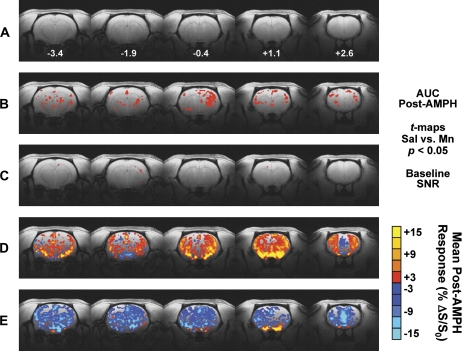
FIG. 3.
Group-averaged map of the BOLD response to AMPH within saline- and Mn-treated subjects within five contiguous coronal slices imaged with phMRI. (A) Anatomic template used as underlay for creation of activation maps. Below each image slice is the approximate rostrocaudal stereotaxic distance from bregma (in millimeters) (Paxinos and Watson, 1998). (B) The entire 60-image post-AMPH percent change in BOLD signal relative to baseline (%ΔS/S0) was integrated for each subject, and the resulting AUC from all subjects in each treatment group (sal vs. Mn) were compared on a per-voxel basis using the Student’s t-test. Red voxels represent significant differences between sal versus Mn groups (t threshold = 2.201, p < 0.05). (C) SNR comparisons for sal- versus Mn-treated groups. (D and E) Colorized BOLD activation maps show the mean per-voxel %ΔS/S0 for the last 15 min of the post-AMPH period (images 76–90) for sal-treated (D) and Mn-treated (E) subjects. The minimum level of activation for the maps in panels D and E is 3%.

