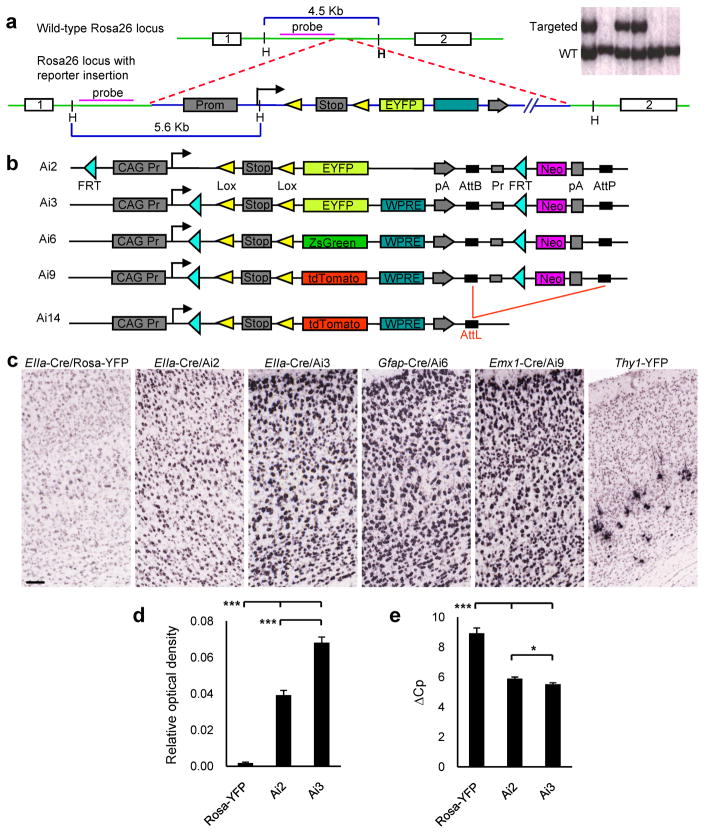
Figure 1.
Generation of the Cre-reporter lines. (a) Schematic diagram of the gene targeting strategy to insert the Cre reporter cassette into the Rosa26 locus, in the intron between endogenous exons 1 and 2. Upper right panel shows a partial Southern blot screen using HindIII digested genomic DNA and the probe indicated in the diagram. Full-length blot is presented in Supplementary Fig. 1 online. (b) Configurations of different Cre-reporter constructs inserted into the Rosa26 locus. The PGK-Neo marker in Ai9 ES clone was deleted by transfection of a PhiC31-expressing plasmid, generating the Ai14 ES clone. (c) Comparison of reporter expression in the cortex between Rosa26-EYFP and new reporter lines. Cre lines used are indicated above each panel. Scale bar, 100 μm. (d) Quantification of EYFP ISH signals in EIIa-Cre/Rosa-YFP, EIIa-Cre/Ai2 and EIIa-Cre/Ai3 mice, with whole brain sections as AOIs. Relative optical density was measured as the IOD ratio: IOD ratio = IOD / total AOI area. IOD = ΣOD(p), such that the optical density of individual expression object pixels are summed over the AOI. *** p < 0.001 (n = 3 sections per brain; Student’s t-test). (e) Quantitative RT-PCR of EYFP using 2 sets of primer pairs on the total RNA extracted from cerebellums of Pcp2-Cre/Rosa26-EYFP, Pcp2-Cre/Ai2 or Pcp2-Cre/Ai3 mice. ΔCp = Cp YFP – Cp Gapdh. Cp, number of real-time PCR cycles. Rosa-YFP, n = 4; Ai2, n = 8; Ai3, n = 12; Student’s t-test. *** p < 0.001. * p < 0.05. Values plotted are mean ± SEM.

