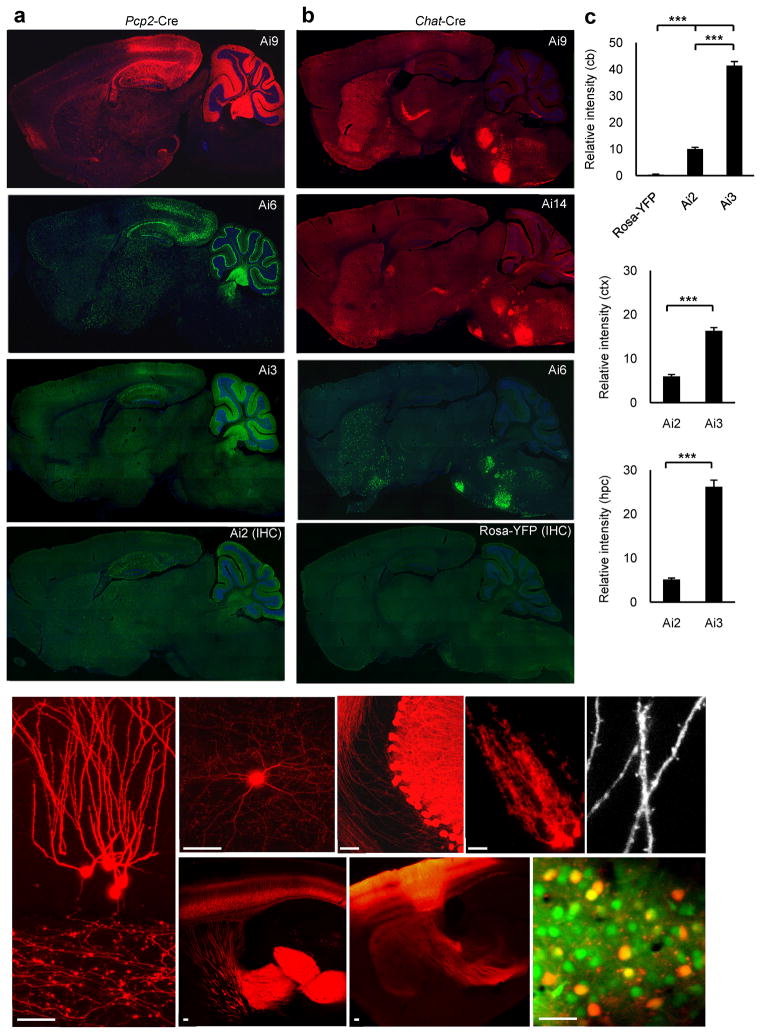
Figure 2.
Significantly enhanced fluorescent labeling in the new reporter lines. (a–b) Comparison of fluorescence in various reporter lines crossed to the same Cre-driver line: Pcp2-Cre in (a), and Chat-Cre in (b). IHC indicates immunostaining using anti-GFP. Unlike tdTomato fluorescence which was also visible in axonal projections, ZsGreen fluorescence was mostly confined to the cell bodies. Scale bar, 500 μm. (c) Quantification of fluorescence in single neurons of Pcp2-Cre/Rosa26-EYFP, Pcp2-Cre/Ai2 or Pcp2-Cre/Ai3 mice, on section images with 140-ms exposure time (no saturation). Three types of neurons were quantified, cerebellar Purkinje cells (cb, upper panel), cortical neurons (ctx, middle panel), and hippocampal CA1 pyramidal neurons (hpc, lower panel). Relative intensity = intensity of the object (cell) – intensity of the background. For each of Ai2 and Ai3, n = 30 randomly selected neurons from 3 sections per region. For Rosa-YFP, only n = 10 randomly selected neurons from one section was used in the Purkinje cell quantification, due to undetectability in the other two. *** p < 0.001. Values plotted are mean ± SEM. (d–h) Distinctive morphologies of various cell types labeled by tdTomato: (d) dentate granule cells; (e) a cortical interneuron; (f) Purkinje cells; (g) cerebellar Bergmann glia cells; (h) dendritic spines. (i) Corticothalamic projections from cortical layer 6 neurons in Ntsr1-Cre/Ai14 mice. (j) Corticothalamic projections in an Ai14 mouse with rAAV-Cre injected into the somatosensory cortex. (k) In vivo 2-photon imaging of tdTomato expressing neurons (red) and OGB-loaded neurons (green) in visual cortical layer 2/3 of an anesthetized Wfs1-Tg2-CreERT2/Ai9 mouse. Scale bar, 50 μm.

