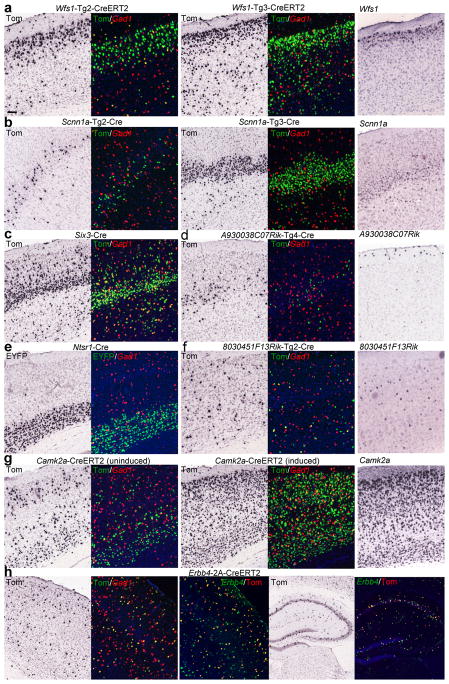
Figure 4.
New Cre lines and their differential recombination patterns in different cortical cell types. For each Cre line, both CISH of the reporter gene (tdTomato (Tom) or EYFP) and DFISH of the reporter (green) with Gad1 (red) are shown for the cortex only. CISH of some of the endogenous genes used to make Cre lines is also shown in the rightmost panel. The mice used are: (a) Wfs1-Tg2-CreERT2/Ai9 and Wfs1-Tg3-CreERT2/Ai9 with tamoxifen induction. (b) Scnn1a-Tg2-Cre/Ai9 and Scnn1a-Tg3-Cre/Ai9. (c) Six3-Cre/Ai9. (d) A930038C07Rik-Tg4-Cre/Ai9. (e) Ntsr1-Cre/Ai3. (f) 8030451F13Rik-Tg2-Cre/Ai9. (g) Camk2a-CreERT2/Ai14 without or with tamoxifen induction. (h) Erbb4-2A-CreERT2/Ai14 with tamoxifen induction, shown for both cortex and hippocampus to demonstrate the scattered population of interneurons. DFISH of Erbb4 (green) with tdTomato (red) shows the faithful but incomplete recapitulation of recombination in Erbb4 positive cells. DAPI staining is shown in blue. Scale bar, 100 μm.

