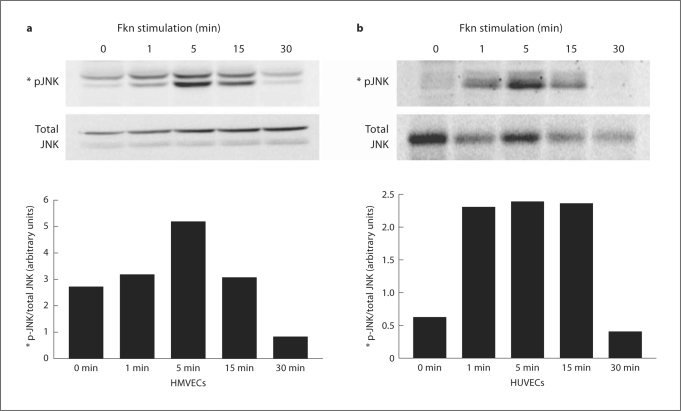
Fig. 4.
Fkn (10 nM) was added to HMVECs (a) or HUVECs (b) for the times indicated and cell lysates were generated. Protein (20 μg/lane) was separated using PAGE and then blotted using standard Western techniques. Phosphorylated JNK was compared with total JNK or actin to assure equal loading. Bars represent normalized band intensity in arbitrary units. Blots are representative of three independent experiments.

