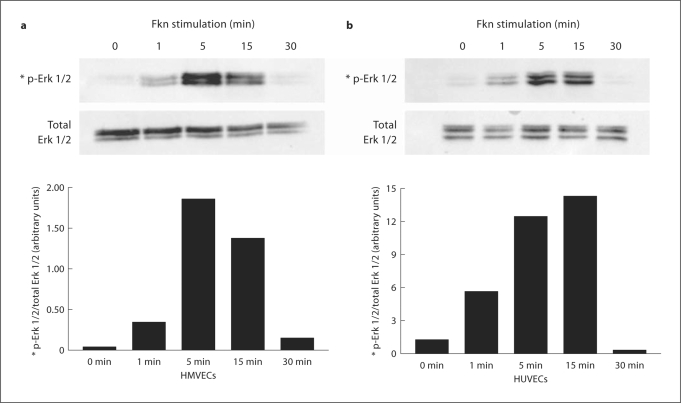
Fig. 5.
Fkn (10 n M) was added to HMVECs (a) or HUVECs (b) for the times indicated and cell lysates were generated. Protein (20 μg/lane) was separated using PAGE and then blotted using standard Western techniques. Phosphorylated Erk 1/2 was compared with total Erk 1/2 to assure equal loading. Bars represent normalized band intensity in arbitrary units. Blots are representative of three independent experiments.

