
Figure 8.
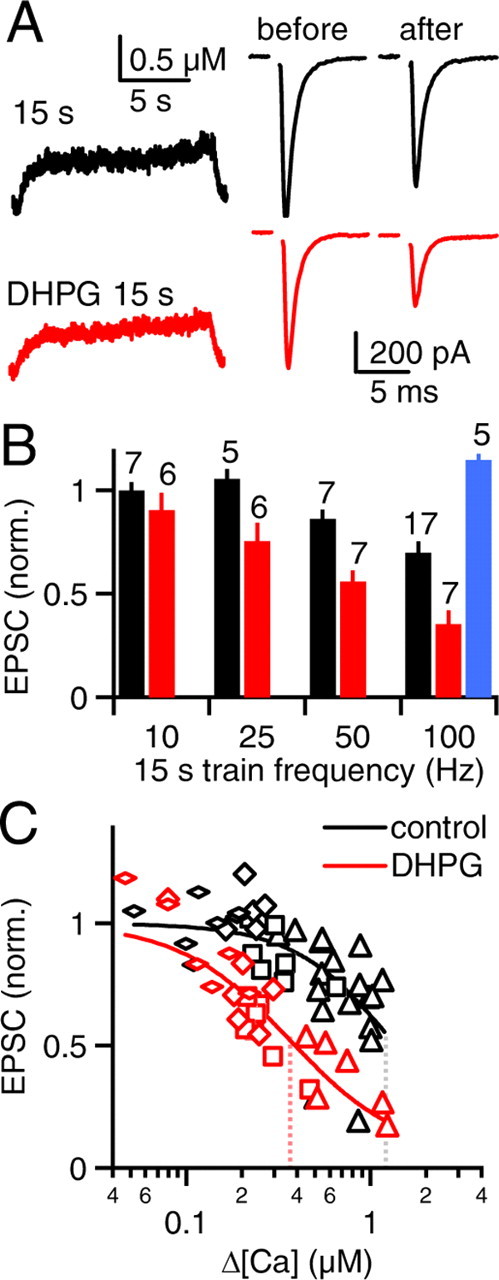
Prolonged somatic action potential trains promote retrograde eCB signaling. PFs were stimulated in voltage clamp and action potential trains were evoked in current clamp as in Figure 7. A, Representative calcium transients (left) and synaptic responses (right) are shown for an experiment in which somatic action potentials were evoked in SCs at 100 Hz for 15 s in control conditions (top) and in the presence of DHPG (bottom). B, Normalized EPSC amplitudes are summarized for 15 s action potential trains of different frequencies for control conditions (black), DHPG (red), and DHPG in the presence of AM 251 (AM, blue). Numbers above the bars indicate the number of neurons recorded in each condition. C, Relative synaptic strength is plotted against peak calcium during the action potential trains and fit to the Hill equation as in Figure 7E. Dotted lines indicate the peak calcium required for half-maximal synaptic suppression (control: K0.5 = 1.3 ± 0.2 μm, n = 1.9 ± 0.4; DHPG: K0.5 = 0.4 ± 0.1 μm, n = 1.4 ± 0.2). Symbol shapes indicate the frequency of the action potential trains (flat diamonds: 10 Hz, diamonds: 25 Hz, squares: 50 Hz, triangles: 100 Hz).