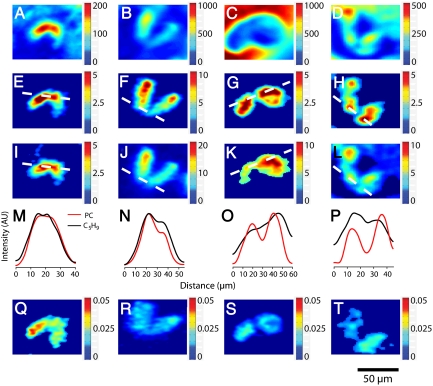
Fig. 4.
SIMS images show the temporal evolution of the observed lipid domain formed during cell conjugation. First row: Total ion images of cells imaged at 1 (A), 2 (B and C), and 3 h (D). Second row: Phosphatidylcholine ion images (m/z 184) of cells imaged at 1 (E), 2 (F and G), and 3 h (H). Third row: C5H9 ion images (m/z 69) of cells imaged at 1 (I), 2 (J and K), and 3 h (L). Fourth row: Line scans of the ion intensities of phosphatidylcholine and C5H9 across the cell–cell junctions for cells imaged at 1 (M), 2 (N and O), and 3 h (P). Fifth row: Normalized phosphatidylcholine ion images (m/z 184 divided by total ion) of cells imaged at 1 (Q), 2 (R and S), and 3 h (T). The color-coded bars indicate the counts per pixel observed in A–L, and in Q–T these show the counts for phosphatidylcholine divided by total counts in each pixel.

